GHG emissions data
Based on the GHG Protocol, the erex Group began calculating GHG emissions as an indicator for achieving carbon neutrality in fiscal 2021. The Company identified and organized its calculation methods for each relevant business activity and emission source and calculated its Scope 1, Scope 2, and Scope 3 emissions. erex will continue to calculate its emissions and monitor the environmental impact of the Group’s operations.
FY2025
FY2024
Historical Emissions Data
Third-Party Assurance
The environmental performance indicators for FY2024 have been verified by an independent third party, the Japan Quality Assurance Organization.
Third-party verification for the current fiscal year is currently in progress.
GHG Emissions for Fiscal Year 2025 (Unit: t-CO₂)
| Scope | Category | CO₂e Emissions (tCO₂e) |
|---|---|---|
| 1 Direct Emissions | 3,025 | |
| 2 Indirect Emissions(Market) | 1,559 | |
| 2 Indirect Emissions(Location) | 10,486 | |
| 3 Other Indirect Emissions | 3,470,262 | |
| 1. Purchased Goods and Services | 179,257 | |
| 2. Capital Goods | 29,902 | |
| 3. Fuel- and Energy-related Activities | 3,082,741 | |
| 4. Upstream Transportation and Distribution | 174,933 | |
| 5. Waste Generated in Operations | 1,646 | |
| 6. Business Travel | 40 | |
| 7. Employee Commuting | 100 | |
| 8. Upstream Leased Assets | – | |
| 9. Downstream Transportation & Distribution | – | |
| 10. Processing of Sold Products | – | |
| 11. Use of Sold Products | 1,642 | |
| 12. End-of-life Treatment of Sold Products | – | |
| 13. Downstream Leased Assets | – | |
| 14. Franchises | – | |
| 15. Investments | – | |
| Total | 3,474,847 | |
When setting the boundaries, we calculate GHG emissions for consolidated subsidiaries among our affiliated companies.
In addition, in this calculation, to reflect the impact of subsidiary mergers and reorganizations, we reviewed our calculation method.
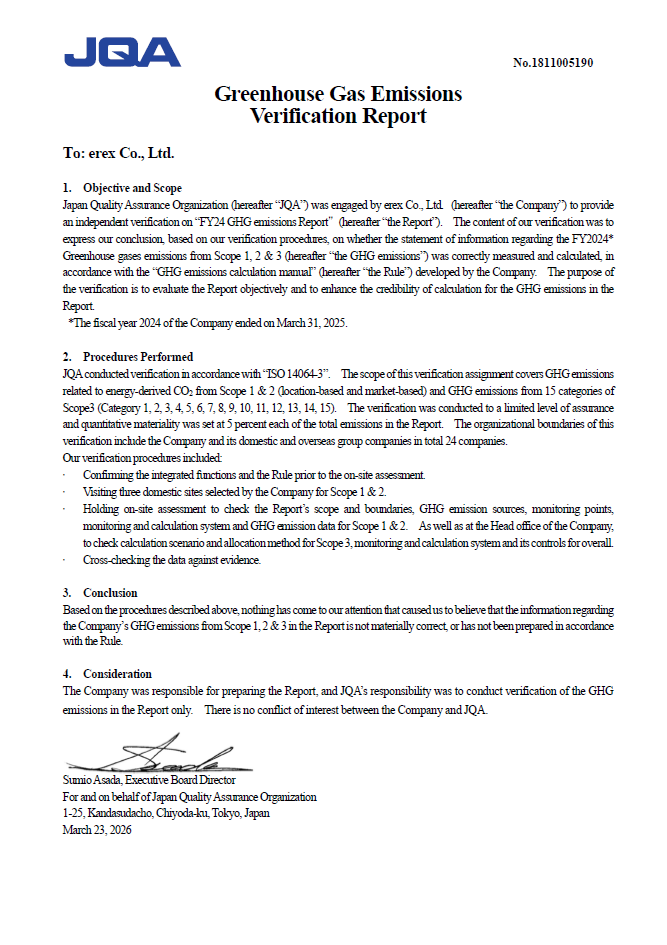
Third-Party Assurance
The environmental performance indicators for FY2024 have been verified by an independent third party, the Japan Quality Assurance Organization.
Independent Third-Party verification report
GHG Emissions for Fiscal Year 2024 (Unit: t-CO₂)
| Scope | Category | CO₂e Emissions (tCO₂e) |
|---|---|---|
| 1 Direct Emissions | 192,895 | |
| 2 Indirect Emissions(Market) | 4,453 | |
| 2 Indirect Emissions(Location) | 3,606 | |
| 3 Other Indirect Emissions | 5,076,456 | |
| 1. Purchased Goods and Services | 152,986 | |
| 2. Capital Goods | 5,036 | |
| 3. Fuel- and Energy-related Activities | 4,719,890 | |
| 4. Upstream Transportation and Distribution | 155,086 | |
| 5. Waste Generated in Operations | 41,649 | |
| 6. Business Travel | 39 | |
| 7. Employee Commuting | 110 | |
| 8. Upstream Leased Assets | – | |
| 9. Downstream Transportation & Distribution | – | |
| 10. Processing of Sold Products | – | |
| 11. Use of Sold Products | 1,659 | |
| 12. End-of-life Treatment of Sold Products | – | |
| 13. Downstream Leased Assets | – | |
| 14. Franchises | – | |
| 15. Investments | – | |
| Total | 5,273,873 | |
When setting the boundaries, we calculate GHG emissions for consolidated subsidiaries among our affiliated companies.
In addition, in this calculation, to reflect the impact of subsidiary mergers and reorganizations, we reviewed our calculation method.
Historical Emissions Data (Unit: t-CO₂)
| Scope | Category | FY2021 Emissions | FY2022 Emissions | FY2023 Emissions | FY2024 Emissions |
|---|---|---|---|---|---|
| 1 Direct Emissions | 800,550 | 511,331 | 480,777 | 192,895 | |
| 2 Indirect Emissions(Market) | 5,841 | 3,143 | 2,871 | 4,453 | |
| 2 Indirect Emissions(Location) | 4,297 | 2,743 | 2,649 | 3,606 | |
| 3 Other Indirect Emissions | 10,997,897 | 8,108,090 | 7,517,691 | 5,076,456 | |
| 1. Purchased Goods and Services | 128,870 | 165,284 | 171,107 | 152,986 | |
| 2. Capital Goods | 170,590 | 5,993 | 7,642 | 5,036 | |
| 3. Fuel- and Energy-related Activities | 10,552,600 | 7,716,089 | 7,120,299 | 4,719,890 | |
| 4. Upstream Transportation and Distribution | 77,060 | 146,947 | 148,887 | 155,086 | |
| 5. Waste Generated in Operations | 66,788 | 71,744 | 67,981 | 41,649 | |
| 6. Business Travel | 30 | 31 | 32 | 39 | |
| 7. Employee Commuting | 79 | 78 | 89 | 110 | |
| 8. Upstream Leased Assets | – | – | – | – | |
| 9. Downstream Transportation & Distribution | – | – | – | – | |
| 10. Processing of Sold Products | – | – | – | – | |
| 11. Use of Sold Products | 1,880 | 1,924 | 1,656 | 1,659 | |
| 12. End-of-life Treatment of Sold Products | – | – | – | – | |
| 13. Downstream Leased Assets | – | – | – | – | |
| 14. Franchises | – | – | – | – | |
| 15. Investments | – | – | – | – | |
| Total | 11,804,288 | 8,622,564 | 8,001,339 | 5,273,873 | |
When setting the boundaries, we calculate GHG emissions for consolidated subsidiaries among our affiliated companies.
In addition, in this calculation, to reflect the impact of subsidiary mergers and reorganizations, we reviewed our calculation method.